
A data analysis & visualization studio for the U.S. housing market.
Independent research, interactive tools, and bespoke
consulting from Aziz Sunderji.
Housing analysis delivered via Substack
Featured essays
All writing on Substack →An Exodus of Children from New York City
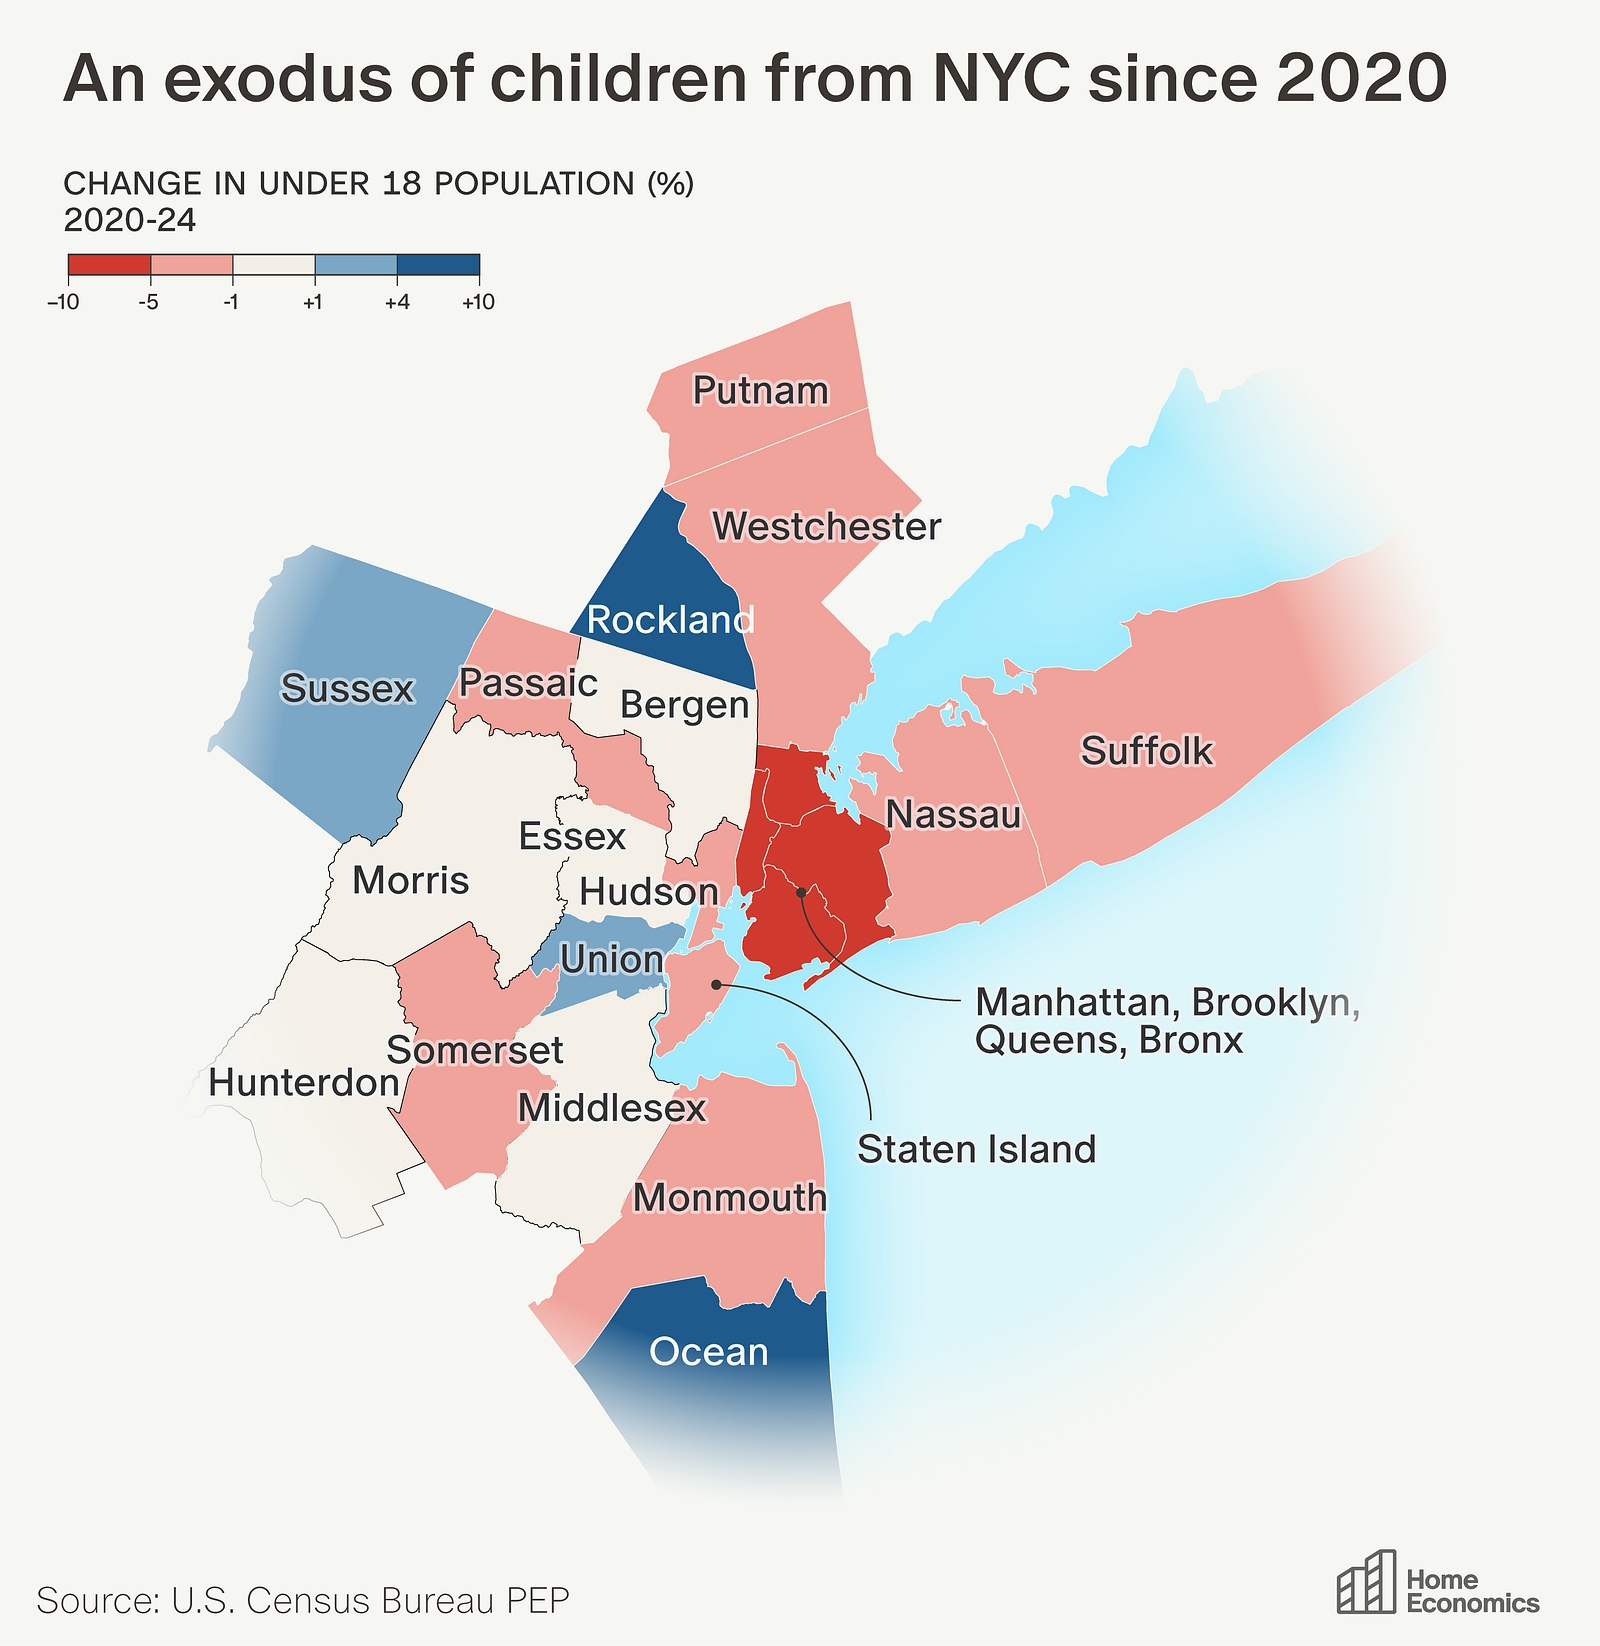
New York City has 150,000 fewer children today than on the eve of the pandemic — a nearly 9% drop. The five boroughs lost three-and-a-half times as many kids in four years as they did in the preceding ten combined.
Where do Parents Find the Time?
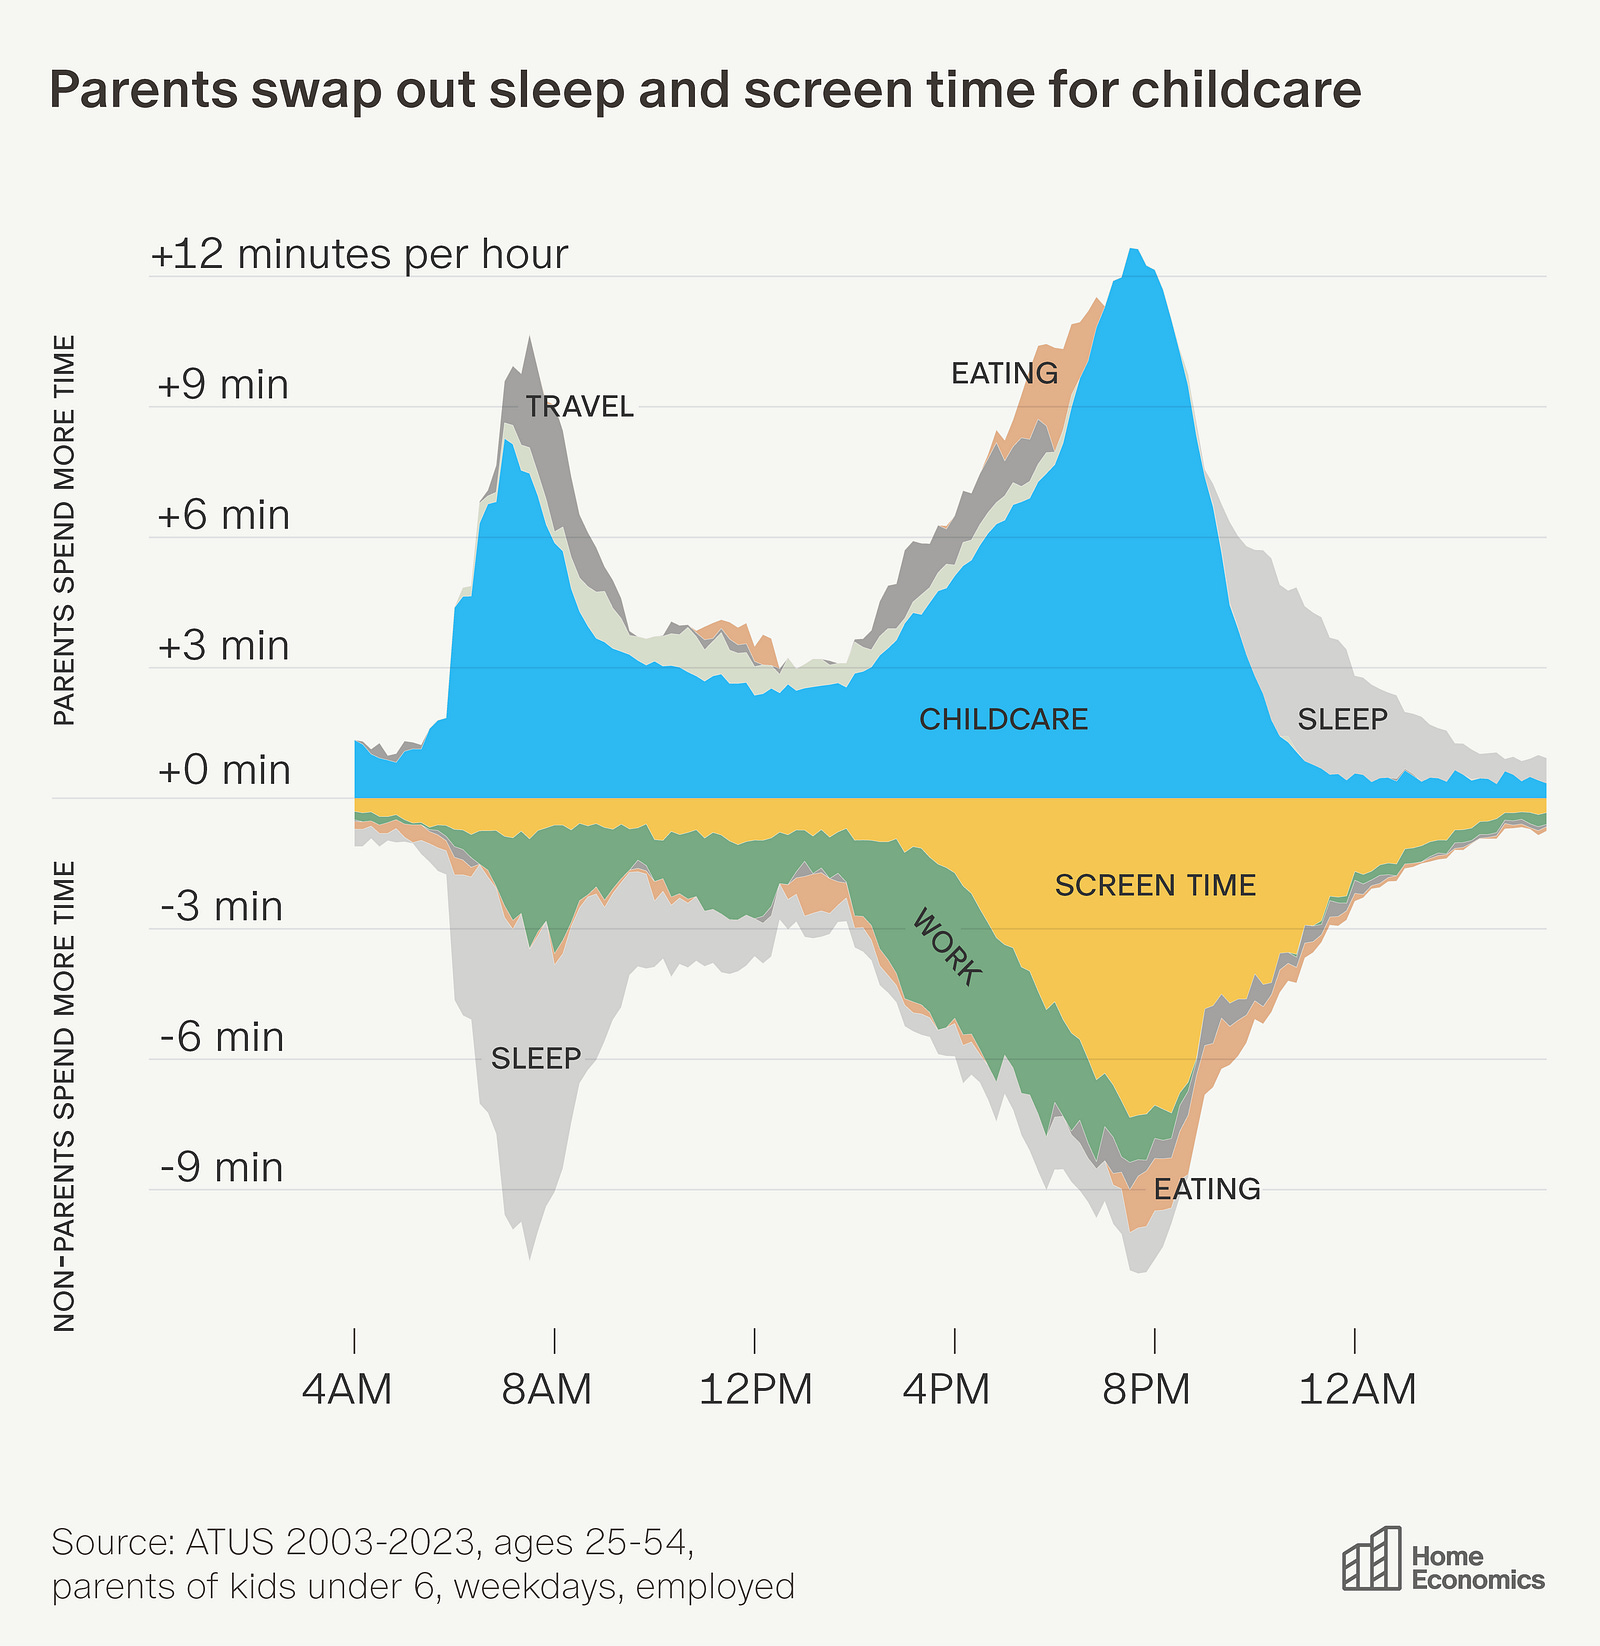
Americans spend more time at home now, but for parents of young children that time looks completely different. They trade up to twelve minutes an hour of sleep and screen time for childcare.
When's the Best Time to Buy a Home?
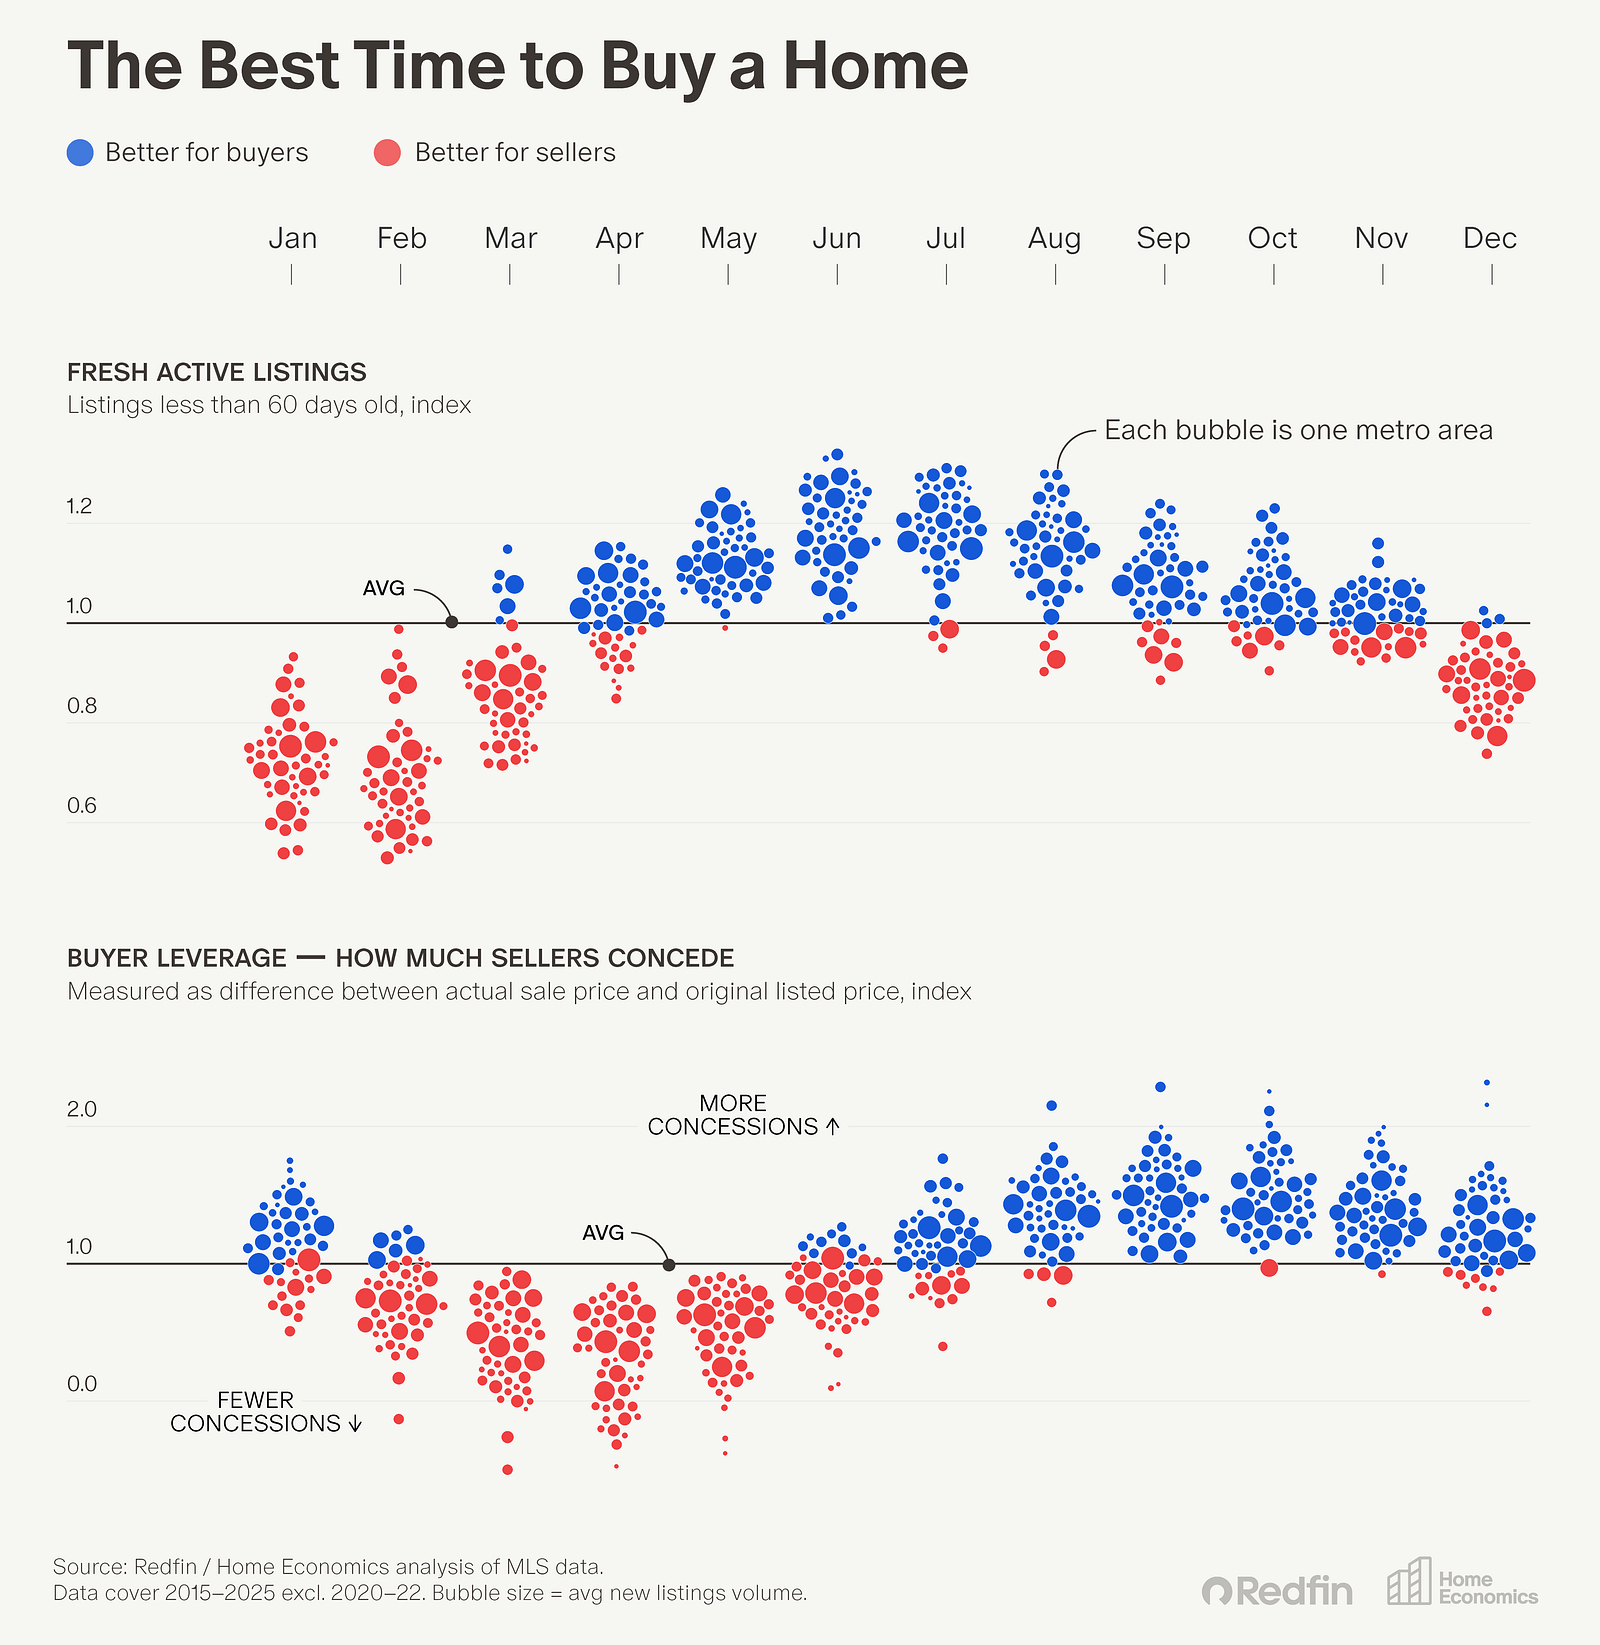
Listings and buyers both peak in late spring, making it the worst time to be a buyer. The cheapest months aren't when prices look lowest but when negotiating room is widest — which is autumn.
Back to the Suburbs: Chicago Edition
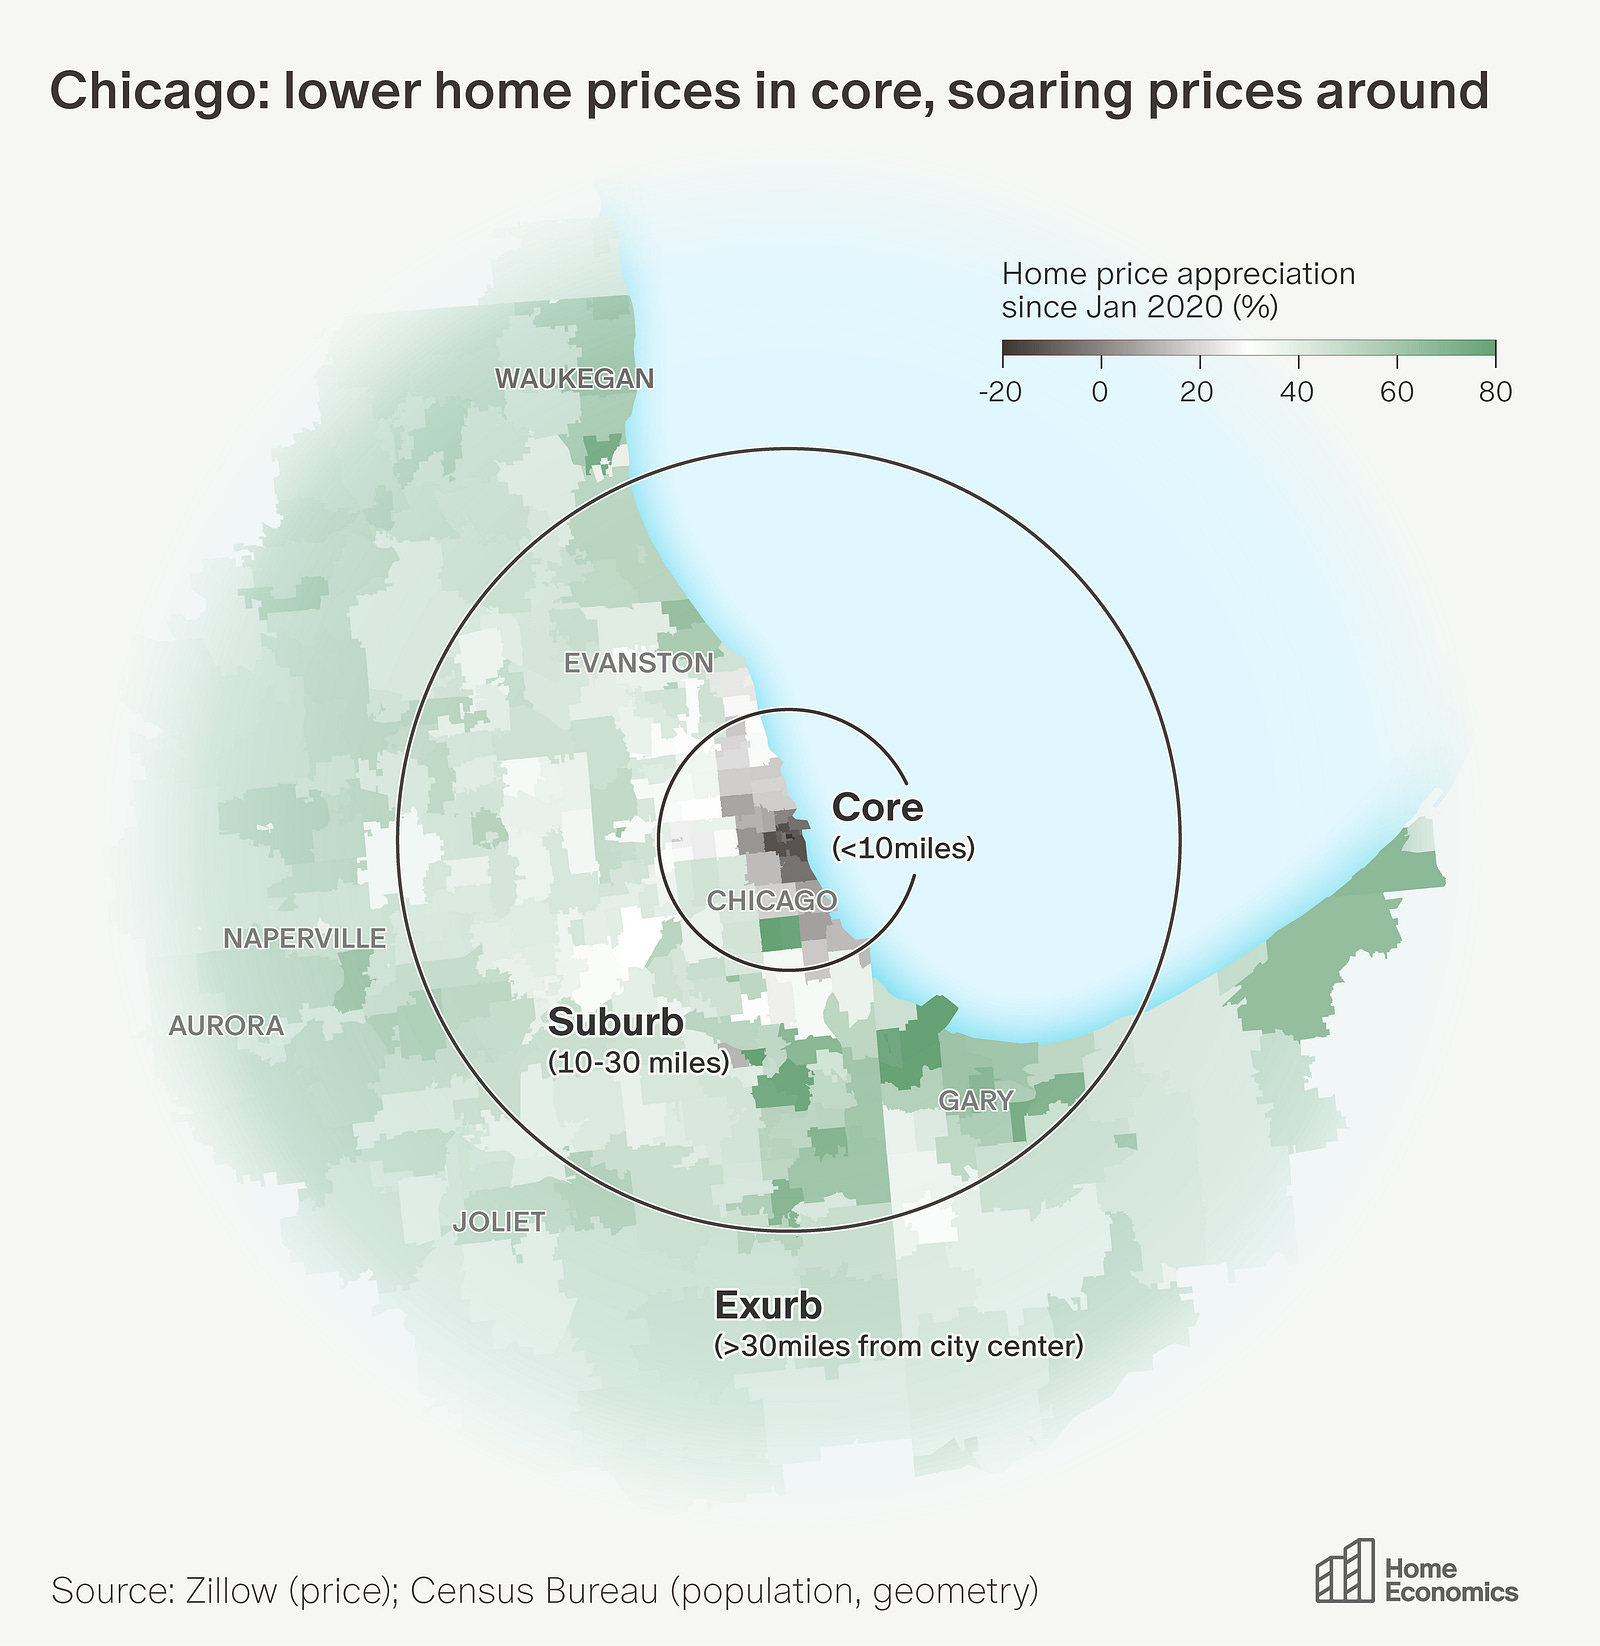
Since the pandemic, prices in suburbs and exurbs have risen far faster than city cores. Chicago's 30-point urban-exurban gap is the third widest of any major U.S. metro, behind only New York and San Francisco.
What Does Your Grocery Store Say About Your Neighborhood?
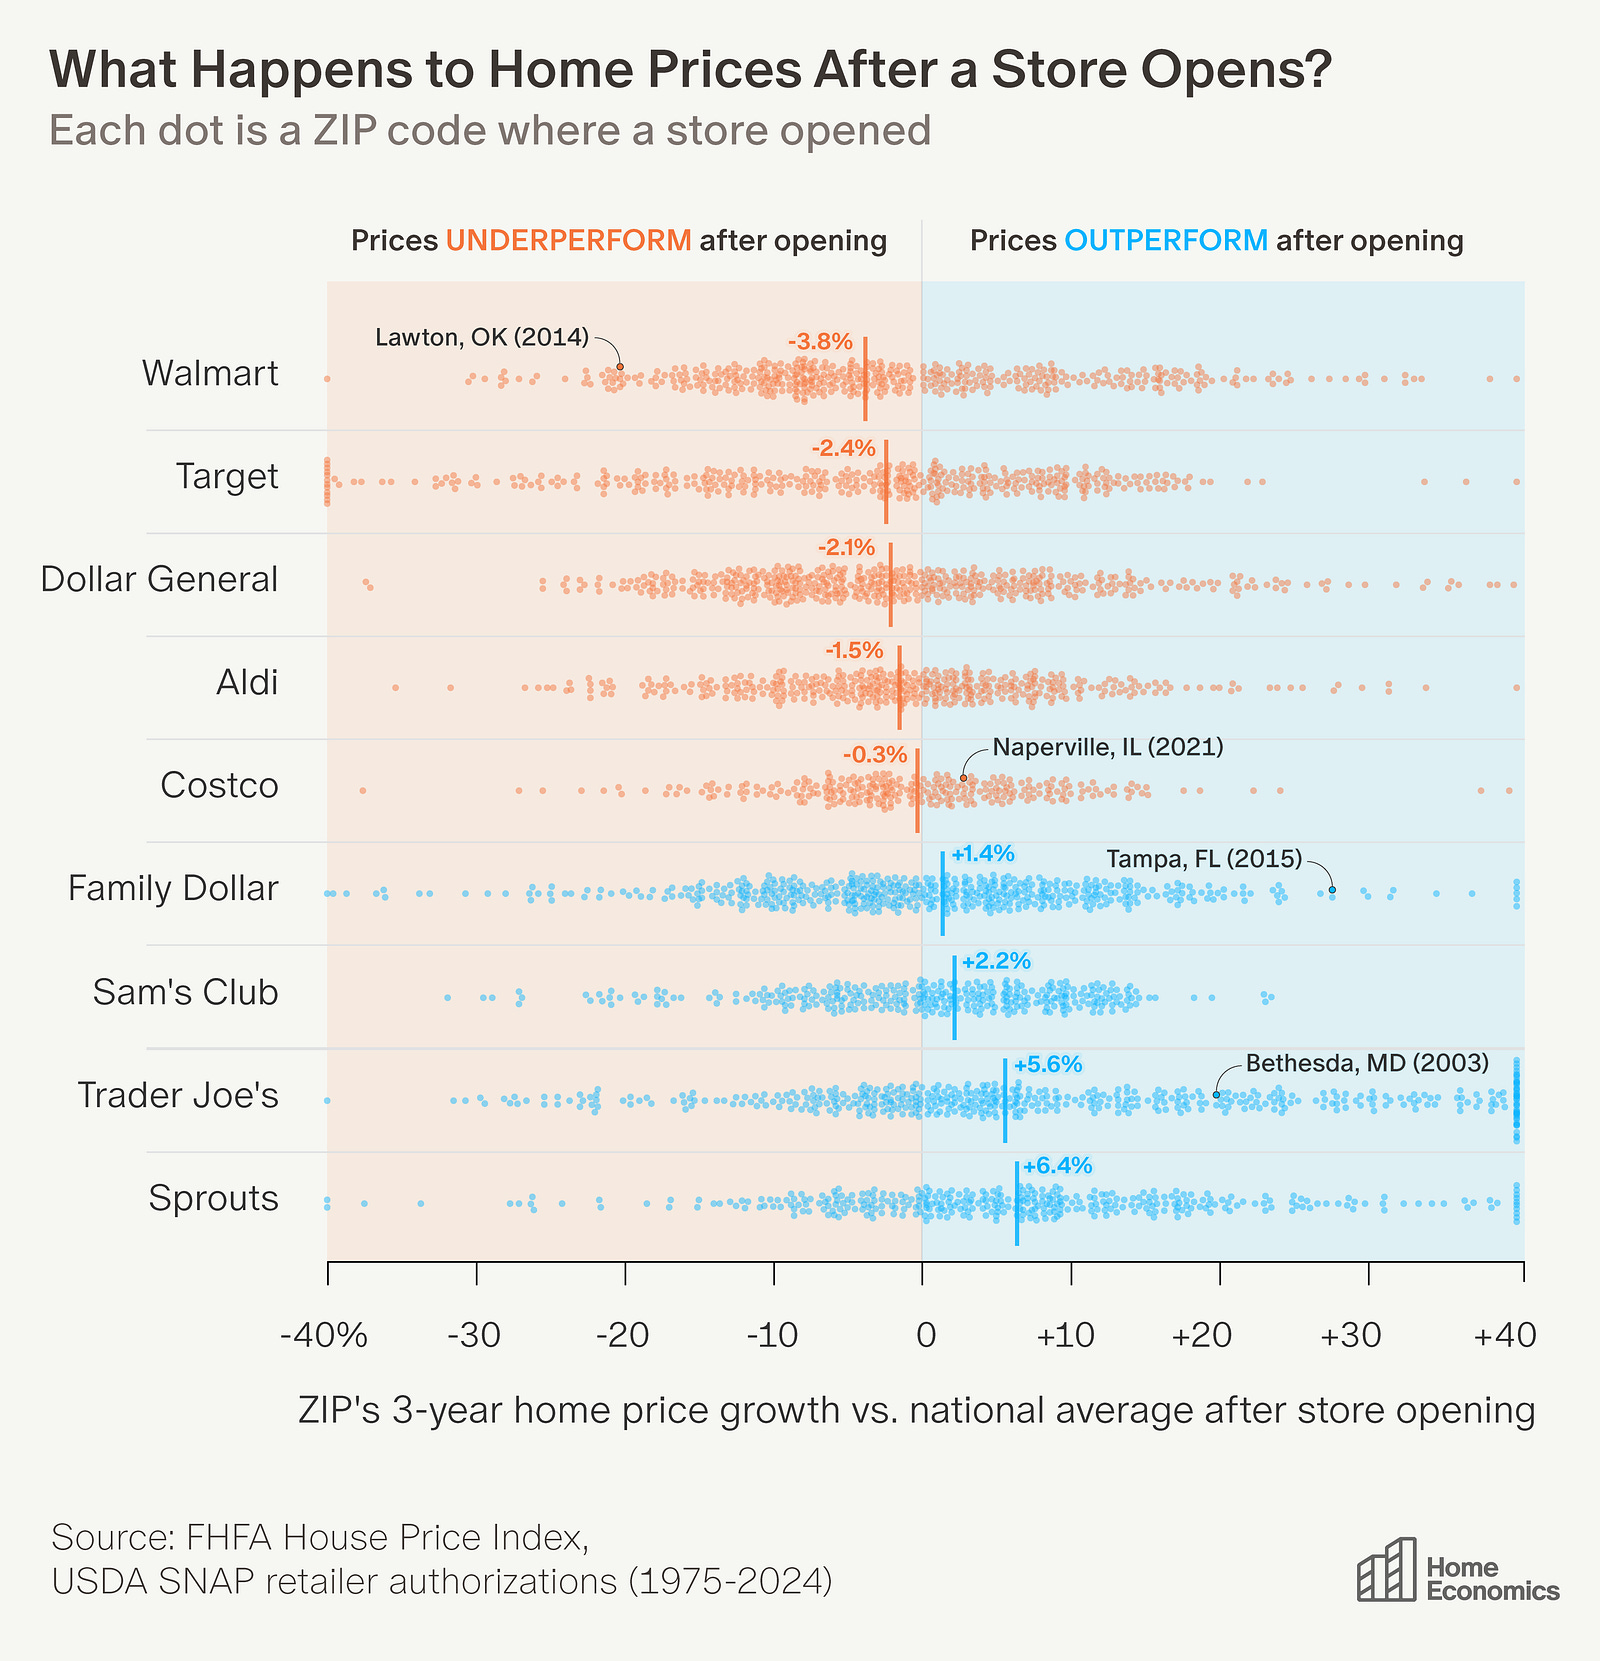
Home prices in ZIP codes where a Trader Joe's opens outperform the national average by 6% over the next three years. In Walmart ZIPs, they underperform by 4%.

Microsites

Why is housing so expensive? A map of the argument — dozens of economists and writers, each in their own published words, on whether the cause is zoning, demand, land, or the cost of building. Every quote is verified against its source, and the rival rebuttals are laid out beside each.
Consulting

High-impact data analysis paired with the visualization to match. Engagements span sourcing and interrogating data, presenting findings to internal teams or external markets, AI-powered workflow design with tools like Claude Code, and bespoke training in data fluency.
Inquire →